For the effective control of advanced plasma processes, appropriate diagnostic tools should be used to identify the plasma characteristics and monitor plasma’s physical and chemical changes. In this study, various diagnostic tools were constructed and plasma parameters were measured to evaluate the intelligence of an inductively coupled plasma (ICP) plasma process equipment [1]. Regression analysis was performed to correlate the measured data with the plasma parameters. As a result, the plasma density (ne) and temperature (Te) were observed to be in good agreement with the noninvasive measurement results. In particular, the Impedans Ltd. Octiv (Poly and Suite) VI probes were highly correlated with almost all the measured plasma parameters. Thus, this methodology can be used for inferring plasma parameters obtained by combining an invasive measurement method with a non-invasive measurement method.
The schematic diagram of the ICP system for the plasma nitriding process (PN-ICP) is shown in figure 1. The radio-frequency (RF) power supply and matching network used for plasma generation was 13.56 MHz, 1 kW from Comet.
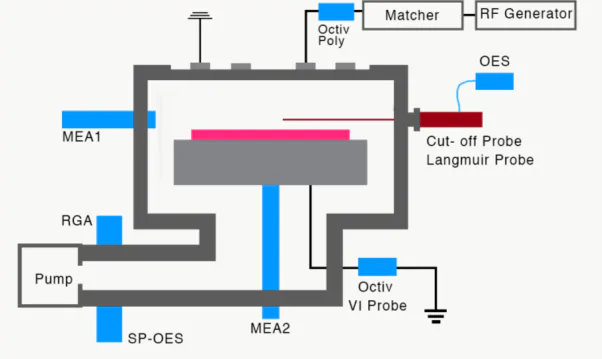
Figure 1. Schematic of the ICP experimental setup and diagnostics.
To diagnose the plasma a cutoff probe (CP), Langmuir Probe (LP), mass/energy analyzers (MEA) for the ionic species measurements, Optical Emission Spectroscopy (HR4000, Ocean Optics) and VI probes (Octiv Poly and Octiv Suite, Impedans) were installed in the reactor. The operating argon gas pressure and RF power for plasma production are 10 to 30 mTorr and 400 to 800 W, respectively.
RF power significantly affects the plasma characteristics and process results. In present study, to measure the RF power harmonic properties at the antenna, the VI probe Octiv Poly was installed. The VI probe Octiv Suite was installed on the substrate. RF forward power data and measurement data of the Octiv Poly VI probe were investigated to verify the RF power characteristics.
The VI probe measurement data indicated that the voltage component of the third harmonic was similar to the RF forward power variation, as can be seen in figure 2. The association of VI probe-specific harmonics with plasma parameters or process results.

Figure 2. RF forward power and 3rd harmonic voltage of VI probe (Octiv Poly antenna), RF power 400 W and 10 mTorr pressure.
Therefore, the association between nine of the VI harmonic components (first to third harmonic and voltage V1-V3, current I1-I3, and phase P1-P3 for each harmonic) and plasma parameters were investigated through regression and is briefly discussed below.
Regression analysis was fundamentally performed to correlate the measured RF data with the plasma parameters. For measurement of plasma parameters (plasma density ne, electron temperature Te, plasma potential Vp, floating potential Vf and acceleration voltage Va = Vp – Vf), a home-made Langmuir probe was used. Simplistic formulation to calculate the coefficient of Regression analysis R2 is shown in figure 3.
Figure 4 shows the correlation between plasma parameters and harmonics of Octiv Vi probe. Results of the analysis depicts that the ne and Te are in good agreement with the non-invasive measurement results. In particular, the Octiv VI probes were highly correlated with almost all the measured plasma parameters. Table 1 presents the factors with an R2 of 0.8 or higher. In the analysis of the plasma parameters, Te was highly correlated to Va. Te and Va are also commonly linked to P2 in their relationship with VI. The R2 for Te with P2 was 0.908, and that for Va with P2 was 0.90. This result implies that there is a possibility of estimating Te using the VI probe P2 data. The I3 component was highly correlated to ne and the coefficients were above 0.85 indicating that I3 was highly related to the plasma density.

Figure 3. Basics of Regression analysis to determine R2 parameter [2]. A higher coefficient indicates a better fit for the model.

Figure 4. Regression results between the plasma parameters and harmonics of VI probe (Octiv Poly). R2 scale is given below.

Table 1. Regression results between the plasma parameters and harmonics of VI probe (Octiv Poly).
Based on the high correlation between the VI probe factor and the plasma parameters observed in this study, it can be expected that the plasma process parameters can be diagnosed in real-time using such non-invasive method.
This work confirms the correlation between the measured RF data and plasma parameters using regression analysis. In this study, ne, Te, and Va were measured using a cutoff probe (CP) and Langmuir Probe (LP). CP and LP are typical invasive measurements; these cannot be used in plasma processing. Mass/ Energy Analysers (MEA) is also a measuring device that is difficult to use in plasma processing. In contrast, the Octiv VI probe is a non-invasive measurement method and is one of the few tools that can be used without affecting the plasma process. Based on the high correlation between the Octiv VI probe factor and the plasma parameters observed in this study, it can be expected that the plasma process parameters can be diagnosed in real-time using a non-invasive method.
[1] Kim Y H et al., “Comprehensive Data Collection Device for Plasma Equipment Intelligence Studies” Coatings 11, 1025 (2021) [Doi: https://doi.org/10.3390/coatings11091025]
[2] M E Macherki, macherkime.blogspot.com
Click Here to download the PDF