Radio-Frequency (RF) voltage-current (VI) probes mounted between the matching network and the plasma can detect plasma impedance changes at the fundamental and harmonic RF frequencies. The plasma impedance is very sensitive to any electrical, chemical, mechanical and/or geometrical changes that may occur in the reactor. The nonlinear nature of the plasma impedance generates a rich harmonic spectrum, accurate measurement of which can be used to precisely detect faults that affect the workpiece being processed, often leading to a scrappage event. In addition to fault detection, endpoint detection is also achieved with plasma impedance monitoring and harmonic monitoring.
Since plasma impedance changes can be monitored indirectly via the plasma harmonic emission, this opens a new area of non-invasive diagnostics.
The RF harmonic spectrum can be measured noninvasively by putting a radio antenna outside the plasma chamber (for example, on an optical window normally used for Optical Emission Spectroscopy (OES)) to detect the RF waveform which can then be digitized and analyzed with a VI probe. By applying statistical methods to analyze changes in the harmonic spectrum, many of the in-line VI probe applications can be achieved from a non-intrusive location. In this application note, we would like to introduce a new product, the Moduli | RF Spectrometer, built on the Impedans’ Octiv VI probe platform.
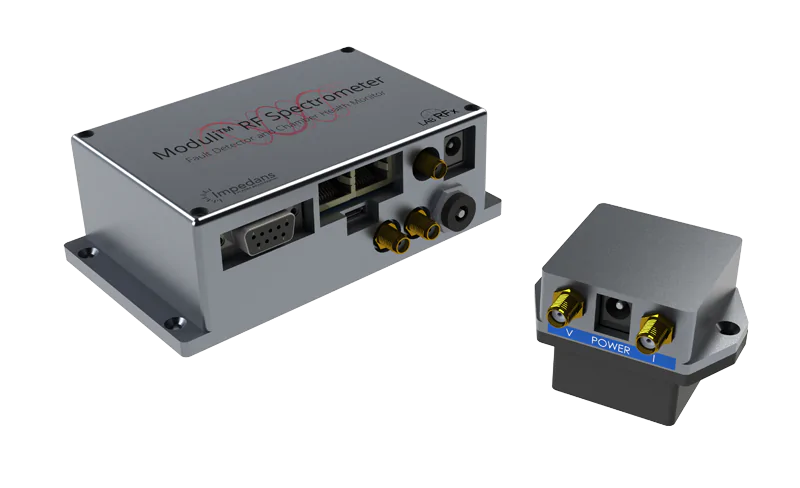
Figure 1. RF Spectrometer for end point
The applications demonstrated for this product so far include air leak detection, wafer misplacement detection, endpoint for deposition and etch processes, and general plasma performance monitoring. This note will explain how the RF Spectrometer operates and will focus on the Endpoint Detection application, for both chamber cleaning endpoint and small open area etch endpoint detection
The RF Spectrometer is a RF detector that directly monitors the electrical state of a plasma from outside the plasma chamber. This is designed for fault detection on production tools without the need for an in-line sensor in the RF path. The RF Spectrometer consists of two parts – a small RF antenna and an acquisition unit [Fig. 1]. It is entirely non-invasive: the antenna can be placed anywhere outside the plasma source where small RF leakage is present – at a window port, for example.

Figure 2. The RF Spectrometer operates in a similar way to an Optical Emission Spectrometer, or OES. The difference is in the frequency range measured. Instead of optical light, from 200 to 800 nm, radio frequency electromagnetic waves are measured, from 400 kHz to 500 MHz. Instead of monitoring the energized atoms and molecules, the RF Spectrometer monitors the electron motion in the plasma
The antenna is split into two parts, so the antenna pick-up can be placed within the RF shielding while the data acquisition unit is placed outside to take advantage of the stronger signals present within the RF environment.
The radio antenna collects the electric and magnetic waveforms from the chamber and sends them to the Acquisition Unit, which extracts the RF harmonics. Up to 5 fundamental frequencies and 31 harmonics can be monitored simultaneously. It should also be noted that both continuous wave and pulsed RF plasmas can be monitored. The RF frequency range is from 300 kHz to 500 MHz, and pulse range 10 Hz to 100 kHz.
The sensor is used in a similar way to an OES system as shown in figure 2. With OES, the changes in light levels are tracked over time to see chemical changes in the plasma. With the RF Spectrometer, the radio emissions are tracked to see electrical changes in the plasma. If the plasma is powered with one frequency, like 13.56 MHz, where do the other radio frequencies (harmonics) come from? The harmonic emissions come from the electron motion in the plasma.

Figure 3. Cleaning endpoint detection example. Top: A plot of the fundamental frequency (red) and harmonic three (black) during
the clean. Bottom: A snapshot of the harmonic spectrum at the Start (left) and End (right), corresponding to the Start and End markers on in the top image. Harmonic changes are indicated by the red arrows.
They don’t move perfectly in sync with the 13.56 MHz sine wave due to the non-linear nature of the plasma impedance, which is impacted by factors including: particle collisions, DC bias, the sheath lengths and the dynamics and properties of the sheath electric fields (which control the plasma density). Therefore, the RF harmonics are strong indicators of plasma, chamber and substrate conditions. [1]
Endpoint detection is primarily achieved using OES systems at present. Specific light frequencies are monitored to indicate the completion of a chamber cleaning process or to indicate when a wafer layer is etched through. OES has limitations, however, and until now the only other options for non-invasive endpoint detection have been expensive to implement e.g. large mass spectrometers or complicated downstream plasma systems. The RF Spectrometer overcomes these limitations for clean and etch endpoint
A. Cleaning Endpoint Detection:
Deposition chambers usually go through a cycle of chamber wall seasoning, wafer processing and chamber cleaning.

Figure 4. A statistical model for endpoint detection. When the full RF harmonic spectrum is within 2 Sigma of the baseline, the chamber is considered clean. This was made using all 60 data channels from the experiment in Figure 3.
Incomplete cleaning can cause cross contamination between different plasma recipes, and it can interfere with the seasoning, a major cause of chamber arcs and particle creation. In some cases, the material being deposited coats over the windows, so OES cannot be used. However, provided the material is non-conducting, RF transmission through the window will be relatively unaffected.
See figure 3 for an example of endpoint detection on a PECVD plasma chamber with completely coated optical windows. The RF Spectrometer antenna was mounted where the OES optical fiber would normally reside. In this cleaning process the power was constant, and the tuning positions in the match box did not change. The signal level from the fundamental frequency (13.56 MHz) did not change from start to end. However, several of the harmonics showed a steady change during the process, until they started
to saturate, indicating that the cleaning was complete.
A baseline for the plasma cleaning recipe was collected by running the clean process when the chamber was already clean. By doing a statistical comparison between the live data and the baseline data, a clear endpoint signal can be defined. In this case, a 2 Sigma difference from an ideally clean chamber is considered sufficient to stop the process. The advantage of the statistical method is that the same setpoint can be applied for every recipe on every chamber, without needing to set upper and lower windows on individual harmonic channels.

Figure 5. Experiment data from Jang et al. [2] for 2% open area ratio SiO2 etching. The endpoint signal is clear in all harmonic channels. OES requires PCA statistical methods at this point.
B. Small Open Area Etching Endpoint:
Etch processes are also typically monitored by OES systems, but the OES method has hit its limit for use in the next semiconductor technology node. When less than 5% of the area of a 300 mm wafer is being etched, OES only works using multivariate statistical methods, due to poor signal to noise ratios. Below 1% open area ratio endpointing is not available with any commercial OES product. In contrast, the RF harmonic method has been shown to work with clear endpoint signals all the way down to 0.5%. [2]
The RF Spectrometer has had similar success in the field for detecting open area ratios down below 1%. The channel(s) of sensitivity can vary depending on the plasma recipe and the tool used for the process. There are four channels to monitor for each harmonic: 1) “voltage” (or electric field channel), 2) “current” (magnetic field channel), 3) the phase between the voltage and current, and 4) the phase between the harmonic and fundamental RF waves.
Figure 5 shows published data from an in-line VI probe mounted between the match box and the plasma chamber for 2% open area ratio, taken from reference [2]. Note how the endpoint signal is very clear in many harmonics in the raw data, before any statistics are applied. Figure 6 shows data from an RF Spectrometer where the statistical technique has been applied. The top graph uses all 60 channels available to detect endpoint, with no selectivity towards sensitive channels.

Figure 6. Endpoint detection using an RF Spectrometer for 25% open area ratio (top) and 6% open area ratio (bottom). The top model used all data channels, whereas the bottom model was selective to sensitive channels only, greatly enhancing sensitivity.
There is a 7.5 Sigma overall change indicating endpoint for 25% open area ratio. The bottom graph only uses sensitive channels for the statistics, greatly increasing sensitivity, this time for 6% open area ratio. A 6 Sigma change is seen as the endpoint indicator.
It has been shown that monitoring the RF harmonic emission from the plasma offers improved sensitivity for clean and etch endpoint detection compared to an optical emission spectrometer. The RF Spectrometer is a new and effective solution for mass production monitoring, due to being as non-invasive as an optical system and offering real-time data output. The RF Spectrometer can detect endpoint in scenarios where OES cannot, such as in deposition chambers and for small open area etch processes.
In addition to endpoint, the RF Spectrometer has been demonstrated to detect air leaks, wafer misplacement and other plasma faults. The harmonic spectrum often responds uniquely to different faults, allowing for fault characterization and thus automated chamber maintenance. These will be presented in future application notes.
[1] J.H. Krenz and G.S. Kino, “Harmonic Generation and Parametric Oscillations in a Plasma” Journal of Applied Physics 36, 2387
doi: 10.1063/1.1714496 Published in 1965.
[2] H.Jang, J.Nam, C-K.Kim, H. Chae, “Real‐Time Endpoint Detection of Small Exposed Area SiO2 Films in Plasma Etching Using Plasma Impedance Monitoring with Modified Principal Component Analysis” Plasma Processes and Polymers 10, 10 doi: 10.1002/ppap.201300030 Published in 2013.
Click Here to download the PDF